Making a Presentation in R: Getting started
Many of us have faced this dilemma: it’s the night before a big presentation and you want to make sure you are prepared. However, as you are going through the slides, you notice there is an error in your analyses and you need to update the results on ALL of your slides. So the night before this big presentation, you end up spending more time trying to manually update the slides one by one than preparing for the presentation itself. As someone who is always searching for ways to automate the manual, error-prone parts of my work so I can spend more time on the important things, I was delighted to learn that there is an option to reduce some of the burden of creating and updating slides by creating presentations in R. In this post, along with ones to follow, I’ll walk through how to do this. First, I’ll highlight some of the biggest benefits of learning how to create presentations in R.
Benefits
-
If you use R to run your analyses, you can easily integrate your graphics & results into your presentation. Instead of having to manually copy and paste the results of your statistical test or the output from ggplot, you can simply write a line of code or two to add those into your presentation. More notably, this means that if you need to update the slides in the future, you will be able to do so painlessly - instead of having to go in slide-by-slide and updating each.
-
With R, you’ll spend less time spent messing around with formatting. For instance, let’s say I want to have all of the images on my slides to be a certain size. It’s much easier to make those changes using code compared to setting the image size one each slide manually
Now that I’ve hopefully convinced you of the benefits of using R for presentations, you may be wondering…
What options do I have to make presentations in R?
I decided to go with xaringan because I’ve been a fan of Yihui Xie’s (creator of the xaringan package) work with other packages and was also persuaded by this post where he explains why he prefers remark.js (which is used behind the scenes to render the presentation) for xaringan presentations over other presentation frameworks. The rest of this post will be focused on setting up a presentation using the xaringan package.
Setting up
-
To be able to create a new xaringan template, we need to install the xaringan package using
install.packages("xaringan") -
Once xaringan is installed, you can create the new template from the drop-down menu on RStudio (assuming you are using RStudio): File -> RMarkdown. A new window should appear, with four possible options for creating the new RMarkdown file: “Document,” “Presentation,” “Shiny,” or “From Template”. Click “From Template” and at the bottom of the list you should see “Ninja Presentation”.
-
Now, you should have a template slide deck that you can edit right away! Super easy. It can even be knitted immediately, which should show up right next to your code under the viewer tab - make sure to save it first!
-
I would highly recommend taking a few minutes to just look at the code and the presentation to see how the input affects the output.
-
So for instance, I immediately notice that there is a YAML header with a few unique parameters, presumably specific to xaringan. For instance, under
output, thexaringan::mood_readerhas the parameterhighlightStyleset to “github.” Since the presentation suggests that the YAML header inputs correspond to the title slide (e.g., YAML header title is set to “Presentation Ninja”), I went ahead and changed title, author, and date for my purposes, leaving other YAML settings as they were:
---
title: "Committee Meeting"
author: "Keana Richards"
date: "2021/03/24"
output:
  xaringan::moon_reader:
    lib_dir: libs
    nature:
      highlightStyle: github
      highlightLines: true
      countIncrementalSlides: false
---
So now that I’ve made those changes, I can knit again, and my title page now has my name, along with an updated date & title!
What’s great is that the template that is created is actually basically a tutorial. So you can look through the slides and follow along!
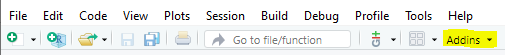
- The Infinite Moon Reader RStudio Addin mentioned on slide 5 is a great idea since you’ll be able to get real-time visual feedback as you update the code (that is, every time you SAVE the code, the visual feedback will be updated). To use this AddIn, you need to click the highlighted “Addins” drop-down here and underneath the tab for xaringan (which will likely be all the way at the bottom of menu because it is ordered alphabetically):
-
It’s also worth noting that the .Rmd document uses Markdown - a tool I mentioned in a previous post - as I mentioned before, you can see this link for a great introductory guide on how to format text using Markdown, which allows you to format certain pieces of text (e.g., italicize the title of your position, link text to a URL)
-
As I mentioned at the beginning, xaringan has remark.js render the presentation in your browser. So to be able to use xaringan for your presentations, you should have a basic understanding of remark.js. I’d recommend checking out the link provided in the knitted presentation, along with this page. In the following section, I’ll briefly describe the fundamentals of creating and editing xaringan slides.
Creating and editing slides in xaringan
Creating new slides
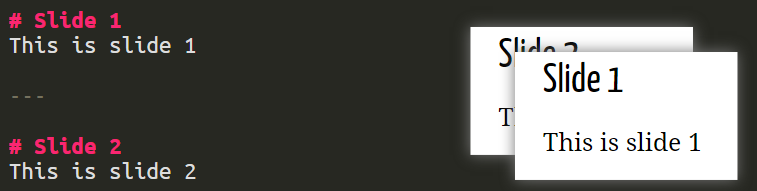
To create a new slide, insert three dashes, like so:
Centering slides
Markdown may not be as flexible as you need it to be, which is why there are Markdown extensions included. So for instance, if I want to center align my entire slide - I would use the class property as follows:
class: center, middle

# Slide with content centered in both dimensions
Background images
Relatedly, I can include background images using a couple of lines of code. Important: background images need to be between the three dashes indicating you are starting a new slide and the name of your slide if you have one (which is indicated using a hashtag, so “Hello world” is the name for the slide below) for the image to be displayed. So for instance, if there is an image at a publicly accessible link, you can use url(insert URL for image):
---

background-image: url(https://upload.wikimedia.org/wikipedia/commons/b/be/Sharingan_triple.svg)
background-size: 100px
background-position: 90% 8%

# Hello World


Install the **xaringan** package from [Github](https://github.com/yihui/xaringan):


---
If you have an image on your computer that you want to include in the presentation, you’ll need to store the image(s) in the same folder as the .Rmd file for your slides or as a subfolder of the folder as your slides file (apparently for security reasons, as suggested here). For instance, if I want to include a file of a picture called “widen-gap.jpg” that is stored on my computer, I’d need to store it in the same location as my .Rmd slides file. Then, if I want to populate the image when I knit the presentation and I put the image in the same folder as the .Rmd file, I would call:
knitr::include_graphics("widen-gap.jpg")
The “libs” directory is the default lib_dir option in the YAML header as suggested
at the end of this issue page, so I would recommend putting the image somewhere in this folder if you don’t want it in the main directory with your slides .Rmd file. Let’s say you created a subfolder called “img” within the “libs” directory automatically included with xaringan holding the .Rmd file. You would call:
knitr::include_graphics("libs/img/widen-gap.jpg")
Incremental slides
To make bullets or images appear incrementally, kind of like slide animations, use the template property. To be able to use the template property, you need to create a name for the slide that can later be referenced. So for instance, you can created the first slide as follows:
name: slide-with-one-bullet

# Methods
- bullet 1
Then, the slide with the second bullet can be created as follows:
## need to add in the three dashes after last slide to indicate a new slide should be created
---

template: slide-with-one-bullet
- bullet 2
So when you go to knit the final document, the compiled slide with bullet 2 will contain bullet 1 as well.
There is actually a shortcut to creating these templates, instead of having to create names & referencing the previous slide based on its name, you can use two dashes between slides to indicate the you want the latter slide to use the former slide as a template, so using the example above:
# Methods

- bullet 1

--

- bullet 2
More details on creating incremental slides here
Default layouts
There’s an option to create a slide that can set the default layout throughout all of your slides. To me, it seems this would be especially useful if you need to have a company’s logo on all of your slides throughout the presentation. To create this default layout, you can set the layout property to true on the slide you want to be used as the default. So for instance, if I wanted the image from the xaringan slides to be on all of my slides, I would write the following at the beginning of the presentation (or wherever you want the logo to start showing up, since the layout will only be applied to slides presented after the layout is set):
---
layout:true

background-image: url(https://upload.wikimedia.org/wikipedia/commons/b/be/Sharingan_triple.svg)
background-size: 100px
background-position: 90% 8%

---
Changing theme
If you want to change things like the font that are pre-set, there are a couple of options:
- you can edit the CSS (the difficult way, unless you, unlike me, have previous experience with CSS)
- you can use themes that R users have created. To explore some theme options, run:
names(xaringan:::list_css())
##  [1] "chocolate-fonts"  "chocolate"        "default-fonts"    "default"
##  [5] "duke-blue"        "fc-fonts"         "fc"               "hygge-duke"
##  [9] "hygge"            "ki-fonts"         "ki"               "kunoichi"
## [13] "lucy-fonts"       "lucy"             "metropolis-fonts" "metropolis"
## [17] "middlebury-fonts" "middlebury"       "nhsr-fonts"       "nhsr"
## [21] "ninjutsu"         "rladies-fonts"    "rladies"          "robot-fonts"
## [25] "robot"            "rutgers-fonts"    "rutgers"          "shinobi"
## [29] "tamu-fonts"       "tamu"             "uio-fonts"        "uio"
## [33] "uo-fonts"         "uo"               "uol-fonts"        "uol"
## [37] "useR-fonts"       "useR"
Let’s say I want to change the theme to rladies.
I can edit the css argument of the YAML header as follows to set the theme as rladies, along with the associated font:
output:
	xaringan::moon_reader:
		css: [default, rladies, rladies-fonts]
Hiding slides
Finally, if you need to hide a slide from the presentation but don’t want to delete all of the work you put into it, you can set the exclude property to true at the top of the slide to hide that specific slide, like so:
---
exclude: true
class: inverse, center, middle

# Get Started

---
Adding figures and results
Now that we’ve covered some of what I think are the most relevant features of remark.js to get you up and running with creating and editing slides, we’ll move onto the part that I’m particularly excited about and one of the main reasons I wanted to create presentations in R: seamless integration of code with the rest of the presentation.
Results
Let’s say I want to include the results of a logistic regression model. To present these results, you use the same basic structure you would use in a normal RMarkdown document to include code in the text-based parts. That is, you include the code you want to run within two backtick marks after you indicate the language you want to use (e.g., r ). So for example, in one of my presentations, I included the following code in the .Rmd document:
---

N = `r nrow(clean1 %>% drop_na(condition))`

---
which is knitted in the presentation as follows:
Figures
There are two options for including plots of your data in a Xaringan presentation:
- The first option is: You can save the plot as a file in the folder or subfolder associated with the .Rmd slides file and then call the image in using the
include_graphics()method described above:
knitr::include_graphics("libs/img/fig00_comp-choice-by-gender-and-cond-bar.png")
- The second option is: You can just import the data and run the code within the presentation itself when it knits! Just make sure to store the data file that will be used in the same folder/subfolder as the .Rmd slides file. For example, if I had the data file in a subfolder of the libs subdirectory associated with my slide .Rmd file:
clean <- read_csv("libs/data/Study1_clean.csv")
You can either show the code you used to create the plots, OR you can hide the code using {r, echo = F} (which is most likely what you will be using unless everyone you are presenting to knows R and wants to double-check your work…). If you want code-hiding to be your default option across all slides, you can insert the code I’ve been using at the top of nearly all of my RMarkdown documents that I plan to present to an audience:
knitr::opts_chunk$set(echo = FALSE, message=FALSE, warning = F)
One final note about figures: it took me a while to adjust the figure size (i.e., to make sure the figure didn’t look too large or small). The settings for the figure size that seemed to work the best (at least for me) were: fig.width=10, fig.height=5, dpi=300. Just enter that into the header of the code chunk, and of course feel free to adjust as needed.
Tables
You can also show tables of your data or models! 😄 Usually, the kable or DT package will work beautifully. One of the useful benefits of integrating your code and presentation is that you can interact with the data live! For instance, let’s say someone asks you what the minimum value of a certain variable is. If you’ve added a table of the dataset using the DT package for instance, you can actually click the sort button on the table in the presentation and answer the question that way.
Presenting and sharing slides
Slide transitions
You can transition from slide to slide like pretty much any presentation. There are also a number of awesome keyboard shortcuts that I highly recommend checking out here
Presenter notes
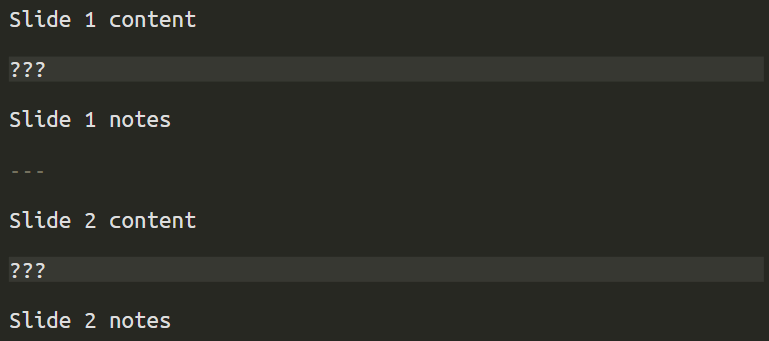
I hadn’t even thought of this before, but there’s a presenter mode! Which I’m now realizing is incredibly important for most of my presentations, since I almost always have notes. To create notes for yourself, insert three question marks in a row:
Once you have the final version of your presentation open in your browser, you want to make sure that your audience doesn’t see your notes - so the way to have them only see the presentation is to open a cloned version of the presentation in a new window which allows you to change slides both in the version with the presenter view and the presentation view with slide notes simultaneously. To create this clone, press “c” and a new window should appear. Press the left and right arrow on your keyboard and you’ll see that both windows change slides at the same time! Super cool. Make sure that when you are presenting your slide using screen sharing, share the new window that popped up when you pressed “c” and not the original tab with your presentation, since that is where your presentation notes will be. Now that you are sharing your presentation, you can simply press “p” on your keyboard while in the original tab (not the new window that you recently opened) to open presenter mode (and to close it, just press “p” again).
A quick note about presenter notes: if you do not have more than one display, I would double-check that you are able to share your screen without your audience seeing your notes. I know there are certain platforms like Google slides that lets you use your notes while you are only sharing one screen, but it may be difficult to present your slides without your audience seeing your notes with one screen using Xaringan from what I can tell.
Converting to different formats
It looks like there is an option to convert your slides to a .pptx and other formats in case you need to send a specific document type over before your big presentation for whatever reason. See
this package for instructions on how to create different document types (e.g., png, pdf, pptx, etc.) from your .Rmd file. If your slides are relatively simple (e.g., they don’t include interactive graphics), you should be able to convert to many output types without a hitch. However, if you are including interactive graphics or other advanced features (e.g.,
panels from the xaringanExtra package), you should set complex_slides = TRUE when you call one of the build_*() functions. Although I will admit, when I tested this out, it did not seem to completely capture what the original .html file was doing with the cooler features, so I personally would try to avoid having to convert to .pptx unless absolutely necessary.
If you want to use your slides offline, you can download a copy of remark.js beforehand, since the default option in the xaringan package is to use an online version of the presentation. See instructions on how to accomplish this here.
Issues that popped up
-
Presenter notes don’t display at the correct time if you place the notes right before the next slide while using incremental slides. Here’s a brief description of this issue: https://github.com/yihui/xaringan/issues/55. My workaround is to place all of my presenter notes at the top of a slide that is incremental and write “(CLICK)” in the notes when I want to click. There might be a more elegant way around this issue though, so I’d recommend exploring Stack Overflow for other recommendations!
-
Occasionally incremental slides do not work as expected. For instance, I inserted the two little dash lines when I wanted to add a new bullet to a slide, but it shows both bullets at the same time. After some exploration, I realized that there was trailing white space after the dashed lines! remark.js is extremely sensitive to this, so make sure that you delete all spaces after the two dashed lines to be able to create your incremental slides. This problem also popped up with presenter notes, make sure not to have white space after question marks or the notes will be rendered as regular text. One option to completely avoid this in the future is to go to the top of the RStudio window, click “Tools” -> “Global Options” -> “Code” -> “Saving” -> “Strip trailing horizontal whitespace when saving”
Resources to explore xaringan further
- https://spcanelon.github.io/xaringan-basics-and-beyond/slides/day-01-basics.html?panelset4=remark.js2&panelset5=nhsrtheme2&panelset6=moon-reader2&panelset7=markdown2#1
- https://www.verouden.net/slides/presentation-xaringan/#1
- https://alison.rbind.io/talk/2019-rsc-xaringan/
- https://www.kirenz.com/slides/xaringan-demo-slides.html#1
Keana Richards
Doctoral researcher
Studying psychology and statistics at the University of Pennsylvania.